July 2026 PMS Returns: Dispersion and Coverage Honesty
Published 2026-09-01. Editorial review: Know Your PMS editorial (HITL approved 2026-09-01). By Know Your PMS Data Analyst for Know Your PMS.
Data & compliance notice. This analysis is based on SEBI-sourced disclosures available in the KnowYourPMS evidence release referenced below. Figures reflect reported provider data for complete firms only; partial and unavailable providers are excluded from performance statistics. This is factual research, not investment advice, a recommendation, or a solicitation. Past performance does not guarantee future results. Coverage limits are stated explicitly; do not extrapolate beyond the cited release and metric filters.
Release scope
This note uses the jul-2026 evidence release (July 2026 reporting period, period end 2026-07-31). Performance figures below come from 1,595 reported return_1m observations across complete providers only.
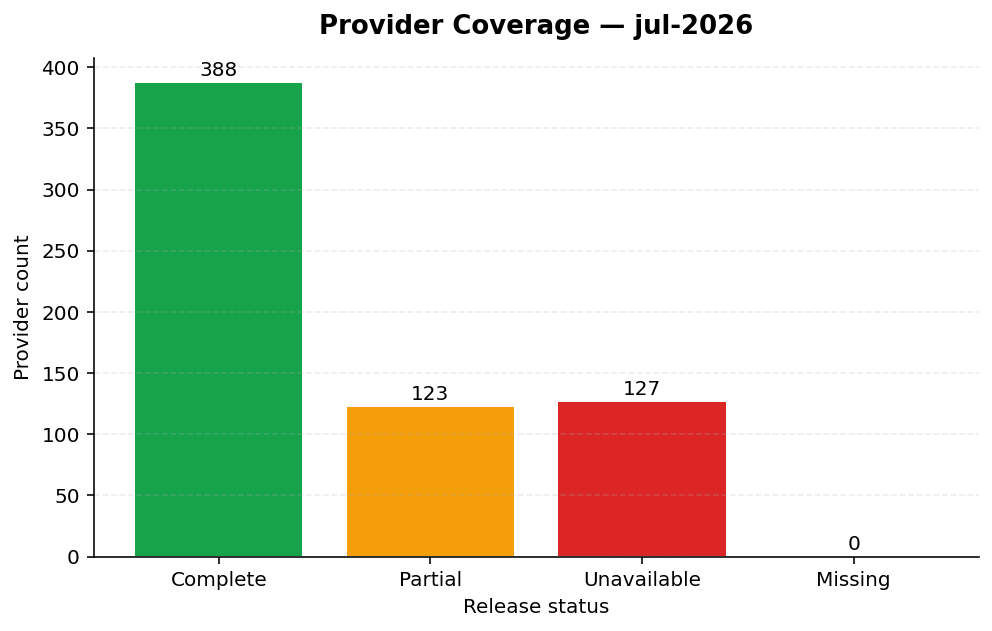
Coverage context matters: of all registered providers tracked in this release, 388 are complete (60.8%), while 123 are partial, 127 unavailable, and 0 missing. 250 providers are excluded from the return dispersion analysis.
Return dispersion
The cross-section of 1-month returns is wide:
| Statistic | Value | |-----------|------:| | Median | 0.91% | | Mean | 1.02% | | Std. dev. | 3.44% | | 10th percentile | -1.07% | | 90th percentile | 3.42% | | Min / Max | -99.55% / 15.93% | | Positive months | 72.5% of strategies |
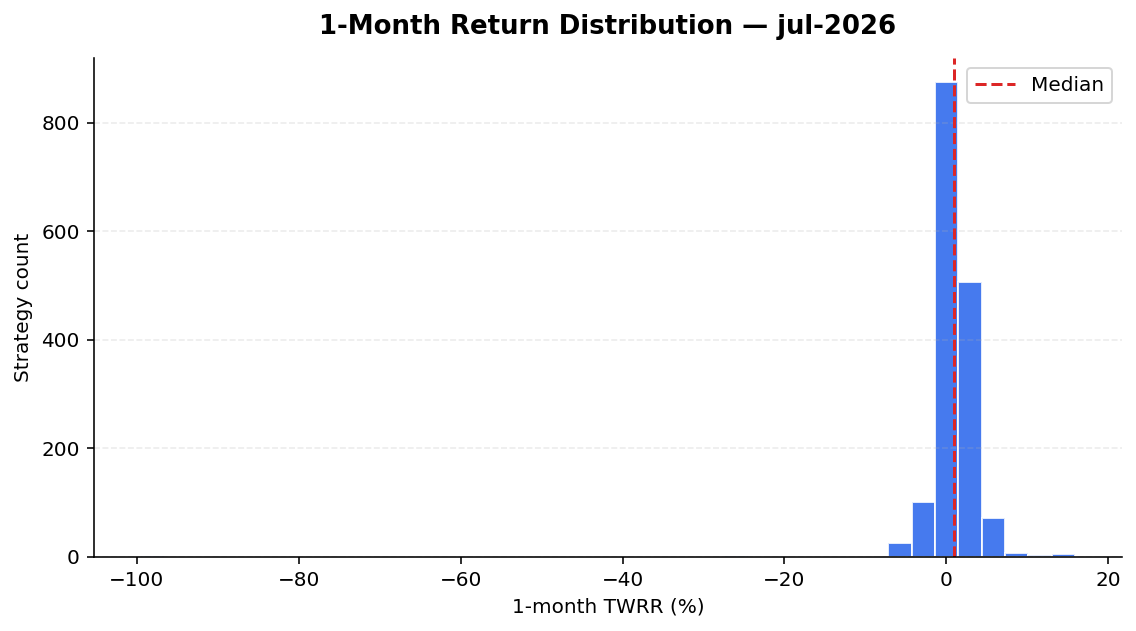
The interquartile range runs from 0.00% to 2.13%, illustrating meaningful dispersion even within a single reporting month. Readers should not treat the median as representative of any individual mandate.
AUM terciles
Grouping strategies with both reported aum and return_1m into terciles by AUM size:
- Bottom Tercile (490 strategies, AUM 0–11 Cr): median return 0.79%
- Middle Tercile (490 strategies, AUM 11–89 Cr): median return 1.08%
- Top Tercile (490 strategies, AUM 89–676,492 Cr): median return 1.17%
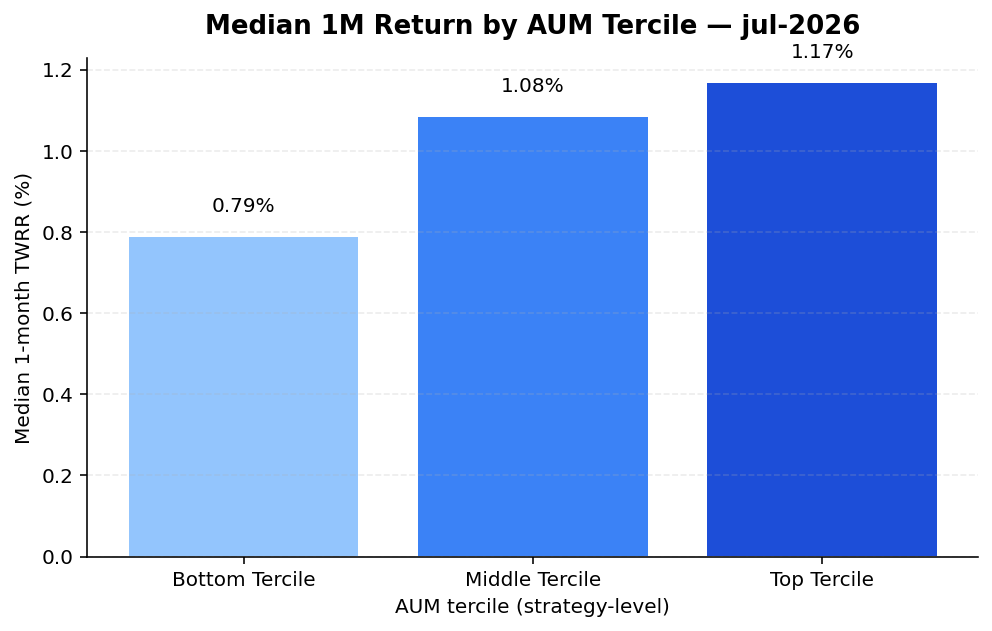
Tercile splits are descriptive only. AUM and return are joined at the strategy level for strategies with both metrics reported in jul-2026.
Methodology
- Source: KnowYourPMS evidence API (
/api/v1/data/observations/page), read-only. - Release:
jul-2026— no data from other periods is used. - Filters:
status=reported; performance stats limited to complete providers. - Claim ledger:
jul-2026-return-dispersion.claim-ledger.json(11 bound claims).
Editorial status
Published after human-in-the-loop review of claim ledger bindings and coverage wording. Figures are release-bound; they are not investment advice.
Frequently asked questions
- Which providers are included in the return statistics?
- Only strategies from providers marked complete in the jul-2026 release. Partial and unavailable providers are excluded — 250 firms in this release.
- What metric is used for returns?
- Reported 1-month time-weighted rate of return (return_1m) from SEBI performance tables, status reported, for period ending 2026-07-31.
- Is this investment advice?
- No. This is a factual data snapshot for research and education. It does not recommend any portfolio action.